Python高级数据处理和可视化1

该系列为南京大学课程《用Python玩转数据》学习笔记,主要以思维导图的记录

6.1 聚类分析
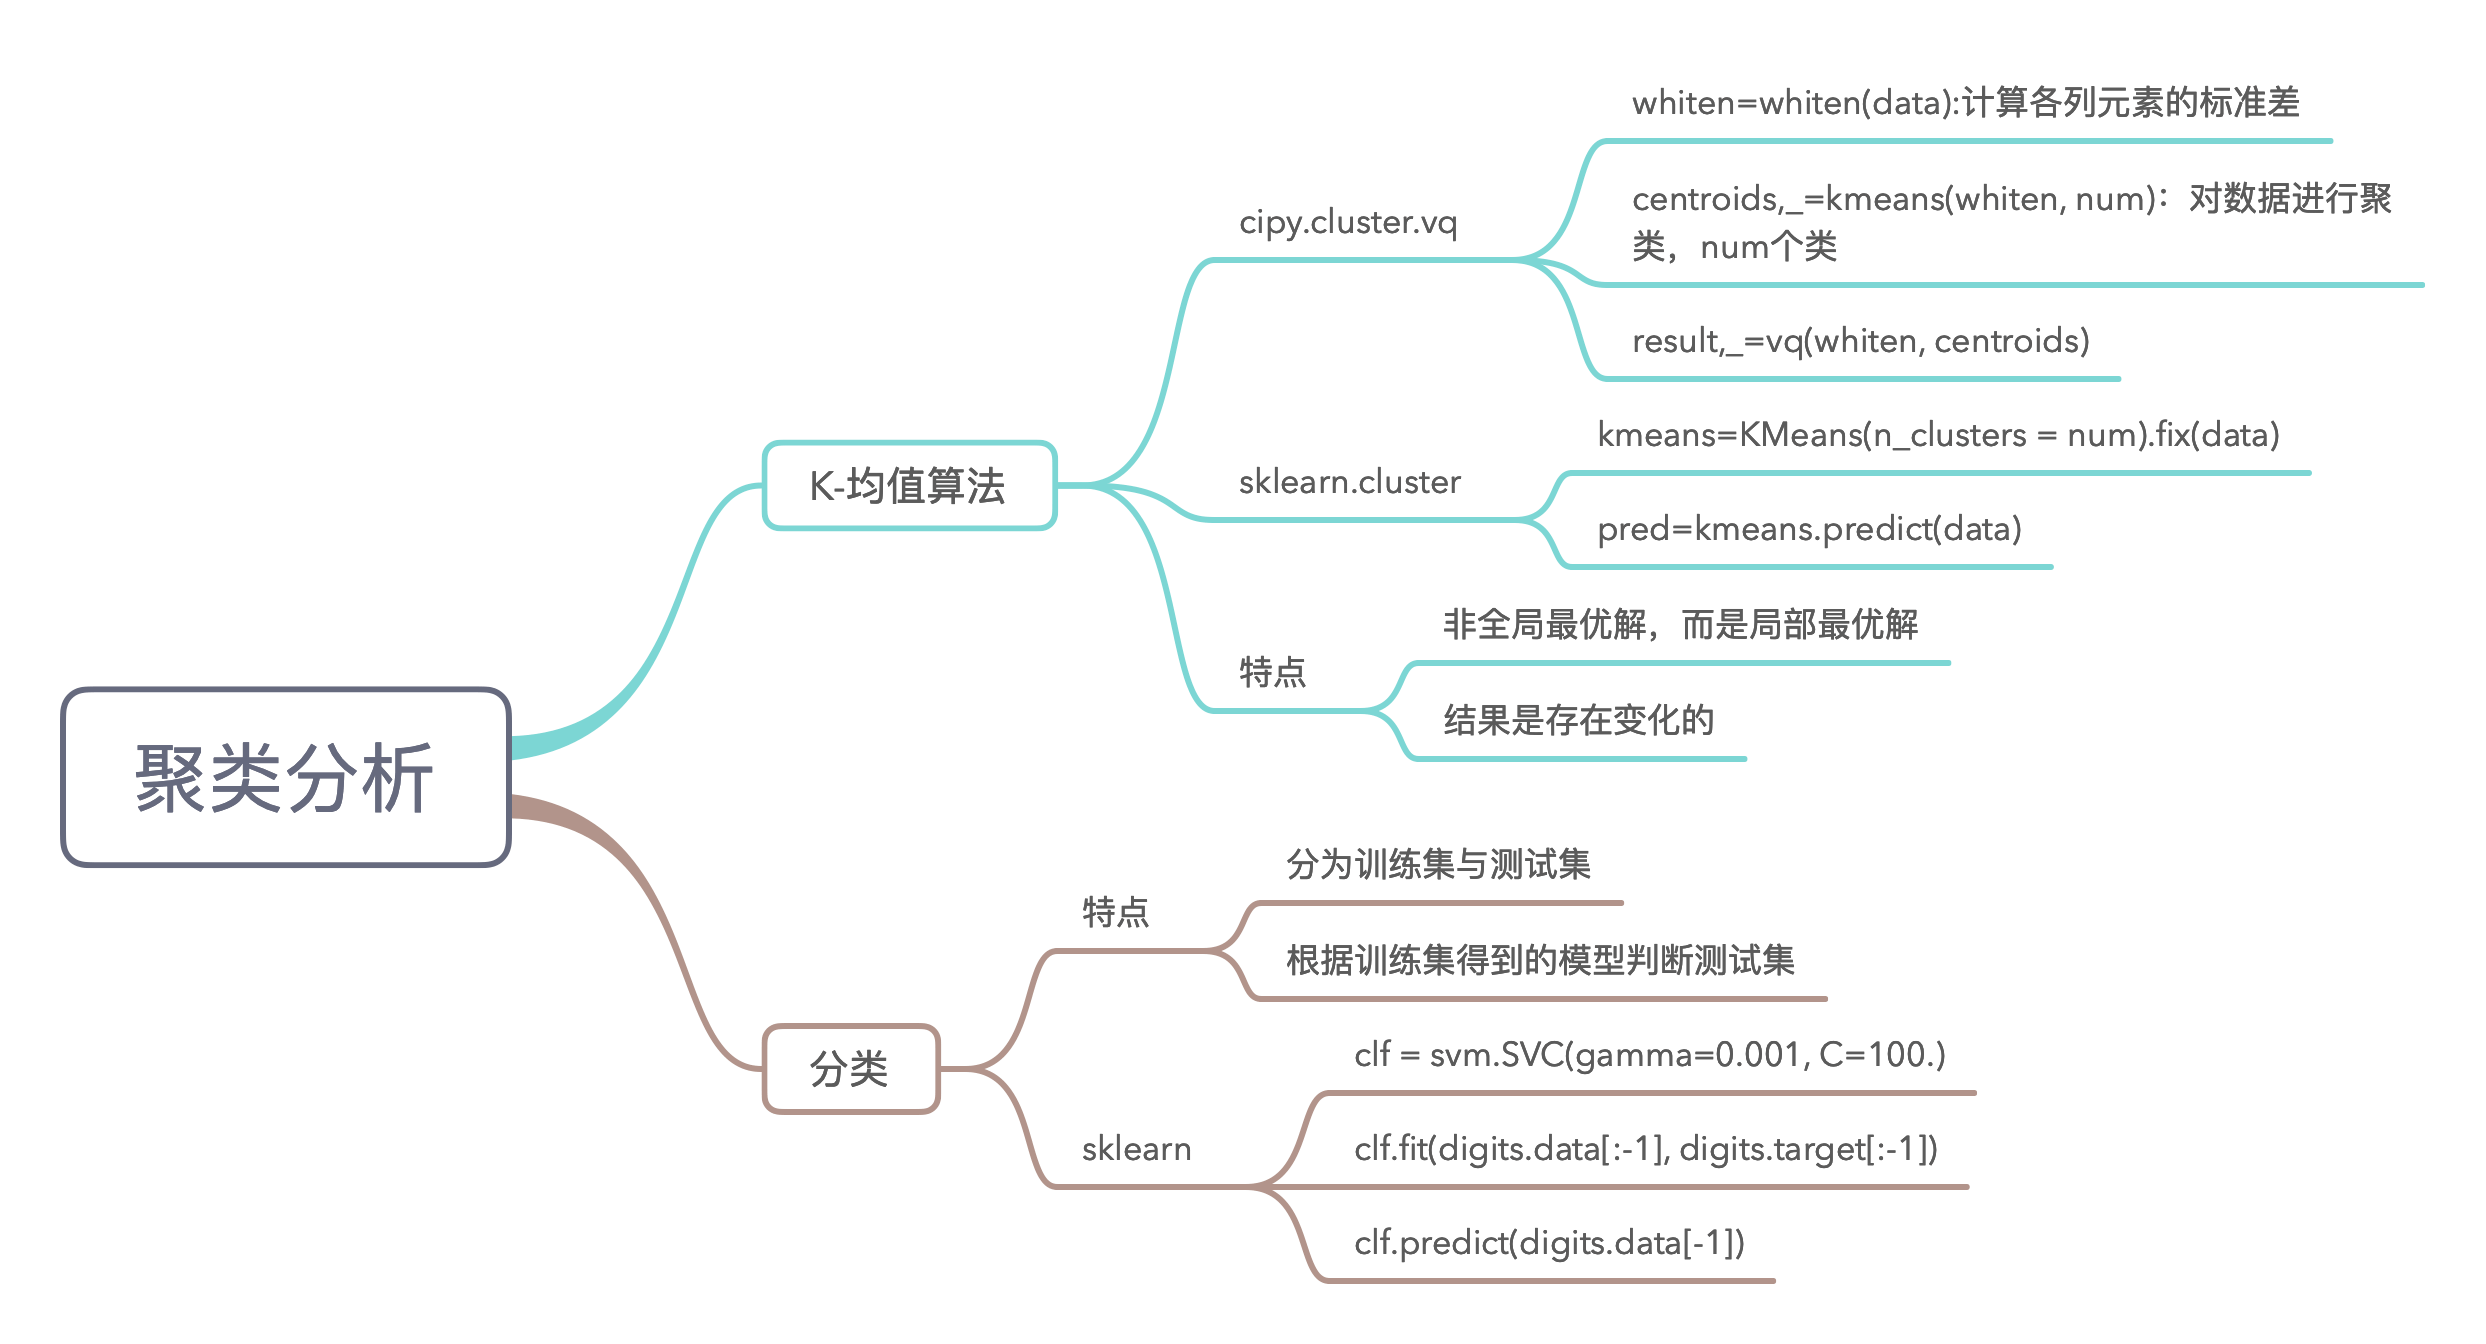
聚类分析

6.1 扩展 scikit-learn 机器学习经典入门项目

scikit-learn 是基于 NumPySciPyMatplotlib 的著名的 Python 机器学习包,里面包含了大量经典机器学习的数据集和算法实现,请基于经典的鸢尾花数据集 iris 实现简单的分类和聚类功能。

实现:

1
2
3
4
5
6
7
8
9
10
11
12
13
14
15
16
17
18
19
20
21
22
23
24
25
26
# -*- coding: utf-8 -*-
# author:zhengk

from sklearn import datasets, neighbors, cluster, svm
iris = datasets.load_iris()

# 利用KNN分类算法进行分析
knn = neighbors.KNeighborsClassifier()
knn.fit(iris.data, iris.target)
pred = knn.predict([[5.0, 3.0, 5.0, 2.0]])
print('result of KNN is ', pred)

# 利用支持向量机SVM分析
svc = svm.LinearSVC()
svc.fit(iris.data, iris.target)
pred = svc.predict([[5.0, 3.0, 5.0, 2.0]])
print('result of svm is ', pred)

# 利用k-means聚类算法进行聚类
kmeans = cluster.KMeans(n_clusters=3).fit(iris.data)
pred = kmeans.predict(iris.data)
for label in pred:
print(label, end='')
print('\n')
for label in iris.target:
print(label, end='')

6.2 Matplotlib绘图基础

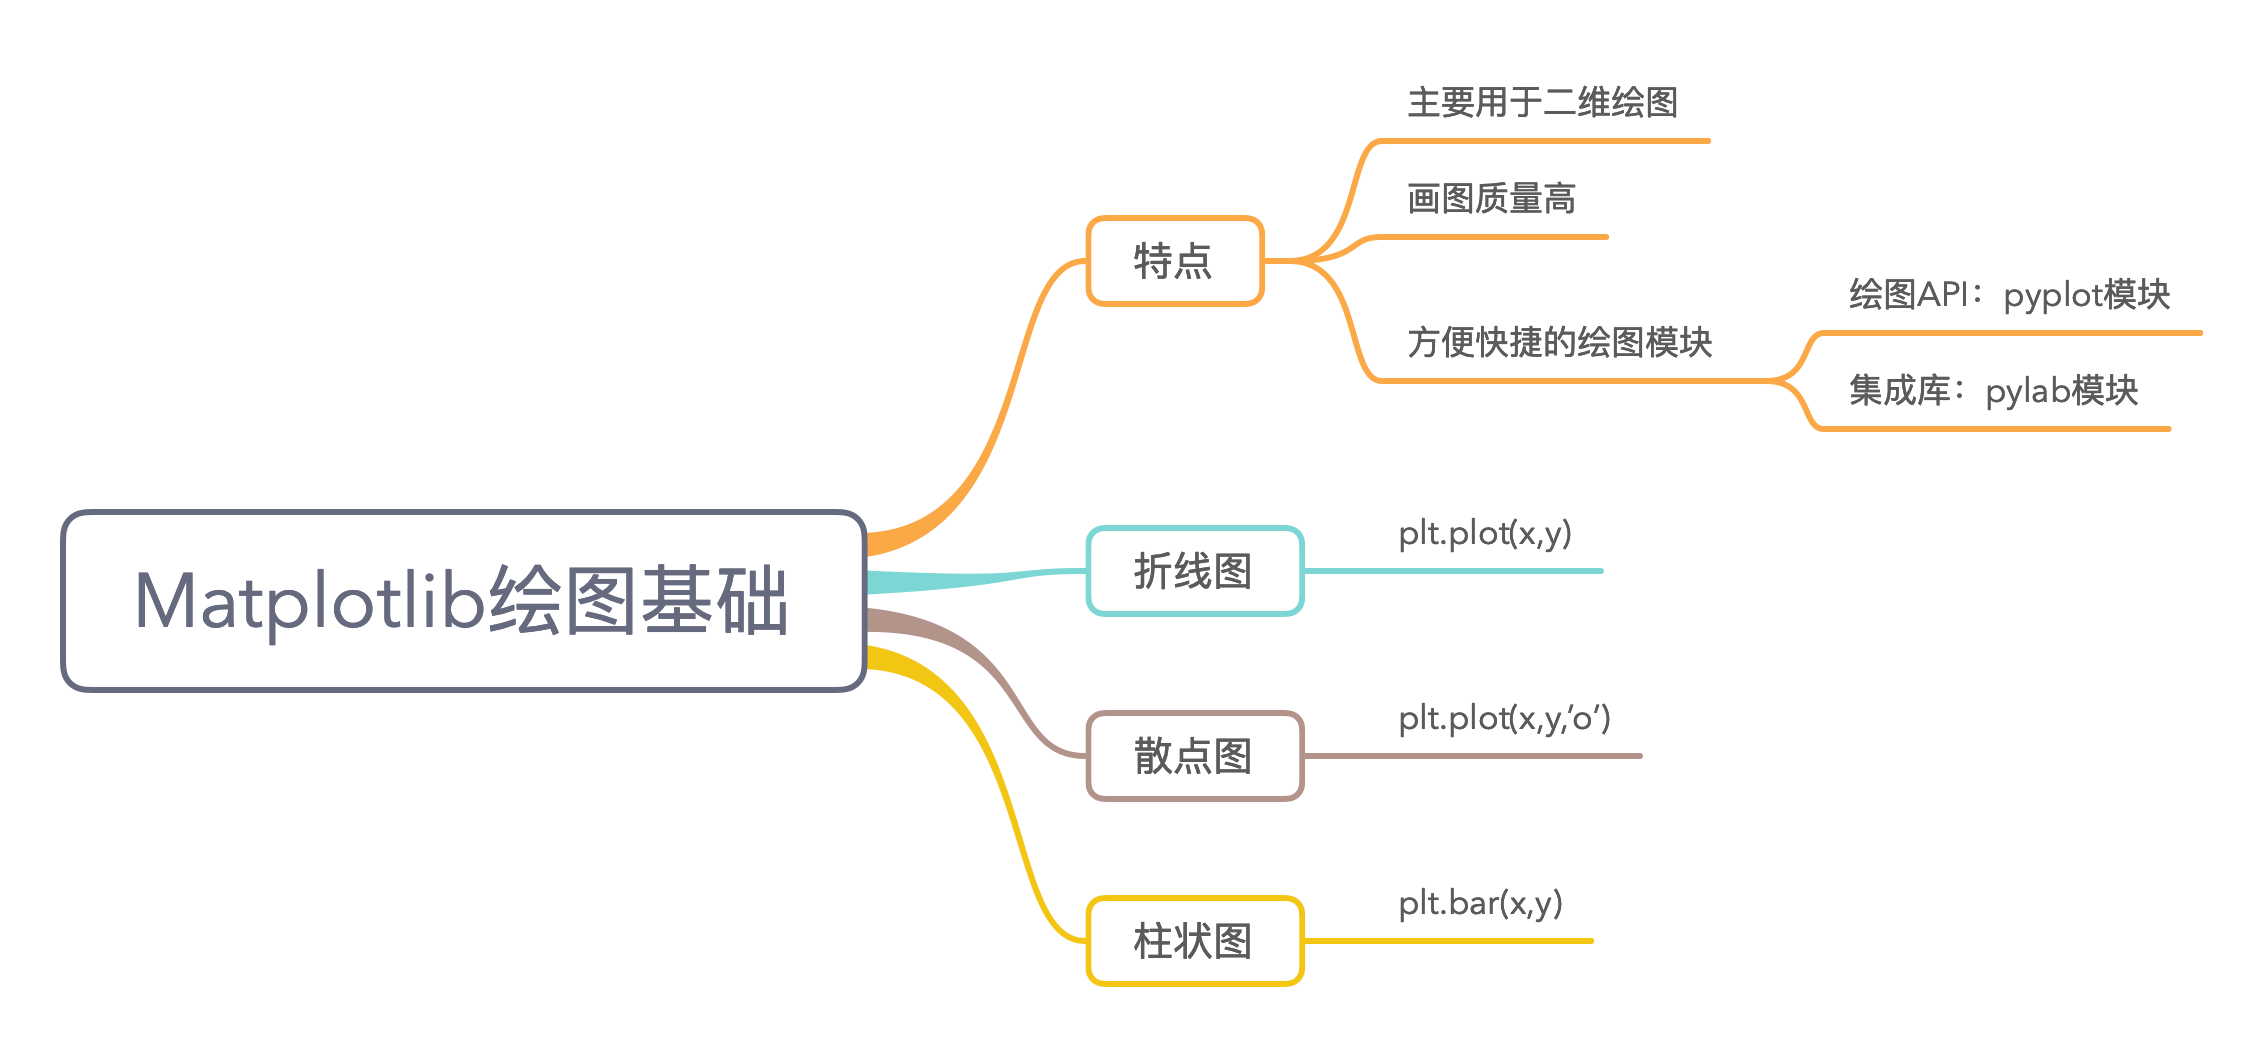
Matplotlib绘图基础

6.3 Matplotlib图像属性控制

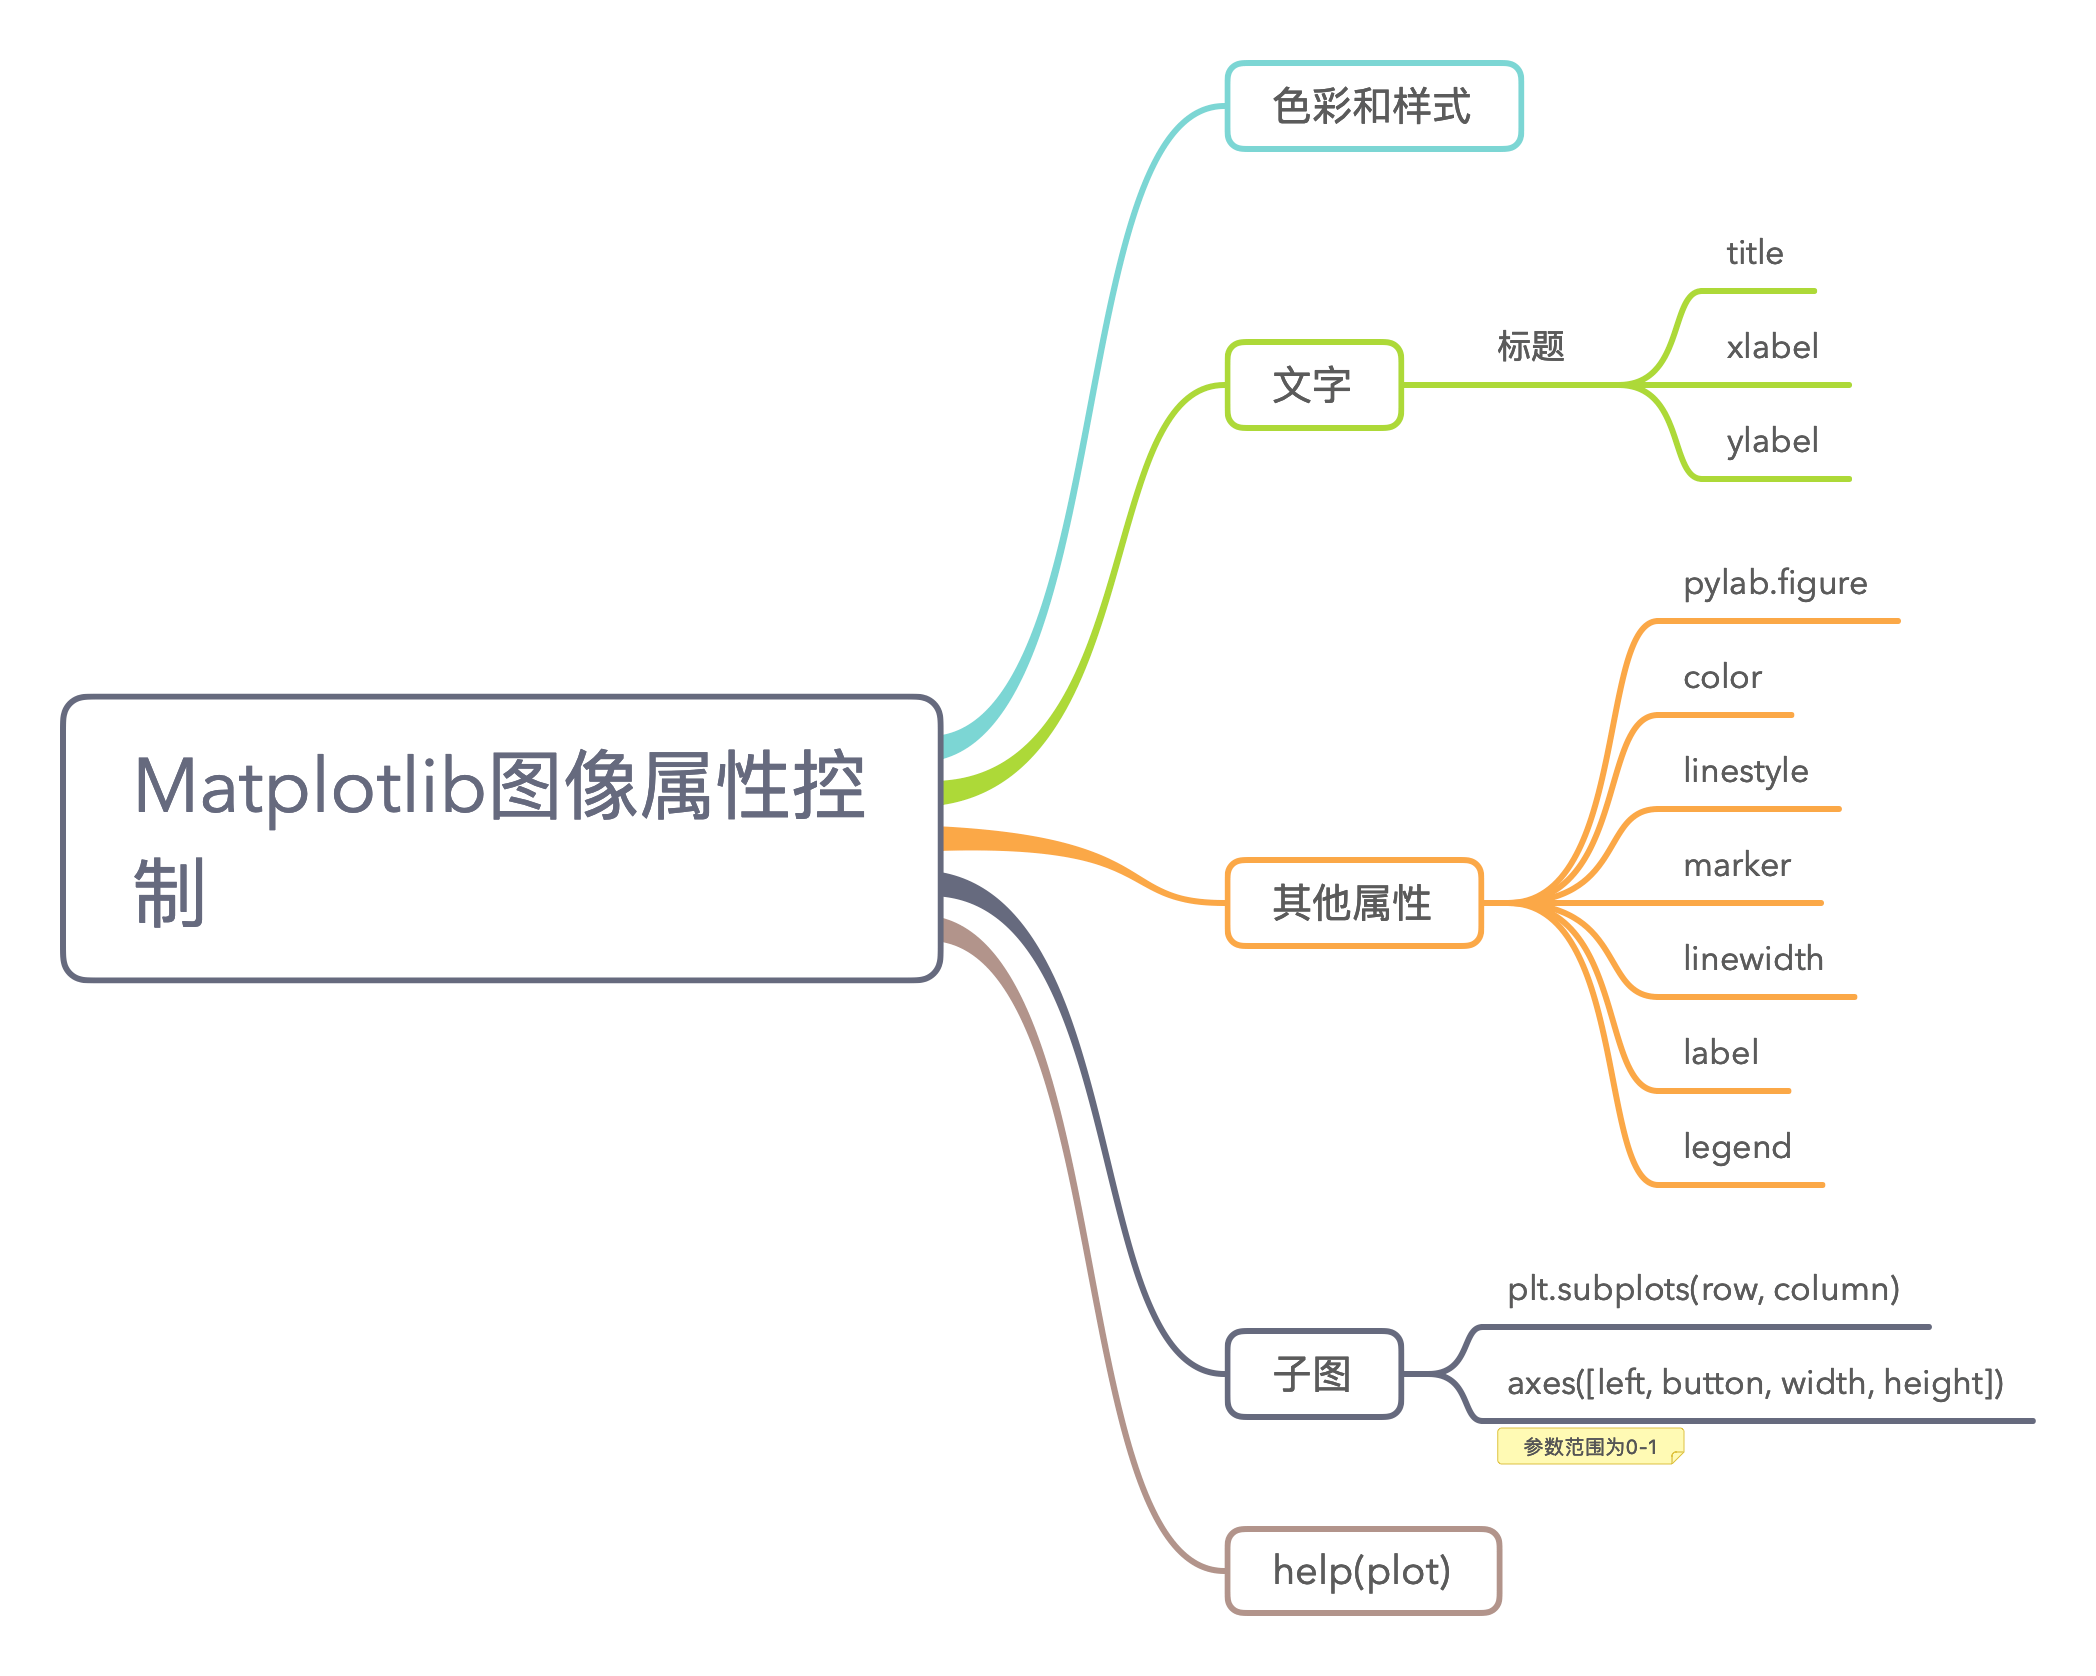
Matplotlib图像属性控制

6.3 练习

1、数据比较图绘制

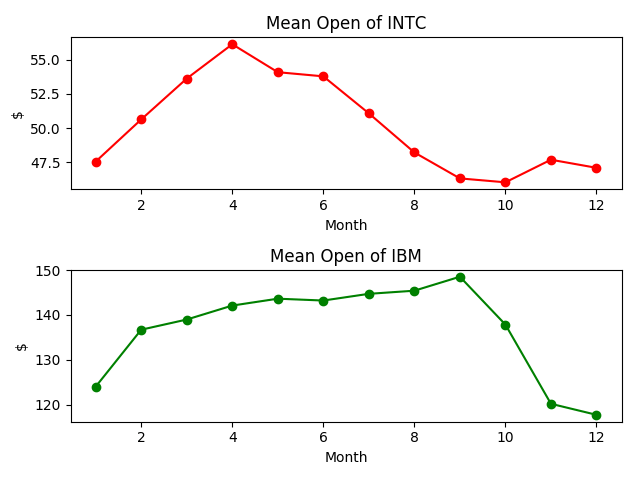
请将 Intel 和 IBM 公司近一年来每个月开票价的平均值绘制在一张图中(用 subplot()或subplots()函数)。

实现:

1
2
3
4
5
6
7
8
9
10
11
12
13
14
15
16
17
18
19
20
21
22
23
24
25
26
27
28
29
30
31
32
33
34
35
36
37
38
39
40
41
42
43
44
45
46
47
48
49
50
51
52
53
54
55
56
57
# -*- coding: utf-8 -*-
# author:zhengk

import requests
import re
import json
import pandas as pd
from datetime import date
import time
import matplotlib.pyplot as plt


def retrieve_quotes_historical(stock_code):
quotes = []
url = 'https://finance.yahoo.com/quote/%s/history?p=%s' % (stock_code, stock_code)
try:
r = requests.get(url)
except ConnectionError as err:
print(err)
m = re.findall('"HistoricalPriceStore":{"prices":(.*?),"isPending"', r.text)
if m:
quotes = json.loads(m[0])
quotes = quotes[::-1]
return [item for item in quotes if not 'type' in item]


def create_aveg_open(stock_code):
quotes = retrieve_quotes_historical(stock_code)
list1 = []
for i in range(len(quotes)):
x = date.fromtimestamp(quotes[i]['date'])
y = date.strftime(x, '%Y-%m-%d')
list1.append(y)
quotesdf_ori = pd.DataFrame(quotes, index=list1)
listtemp = []
for i in range(len(quotesdf_ori)):
temp = time.strptime(quotesdf_ori.index[i], '%Y-%m-%d')
listtemp.append(temp.tm_mon)
tempdf = quotesdf_ori.copy()
tempdf['month'] = listtemp
meanopen = tempdf.groupby('month').open.mean()
return meanopen


open1 = create_aveg_open('INTC')
open2 = create_aveg_open('IBM')
plt.subplot(211)
plt.title('Mean Open of INTC')
plt.xlabel('Month')
plt.ylabel('$')
plt.plot(open1.index, open1.values, color='r', marker='o')
plt.subplot(212)
plt.title('Mean Open of IBM')
plt.xlabel('Month')
plt.ylabel('$')
plt.plot(open2.index, open2.values, color='green', marker='o')
plt.show()

结果:

6_3_1

2、iris数据集绘图

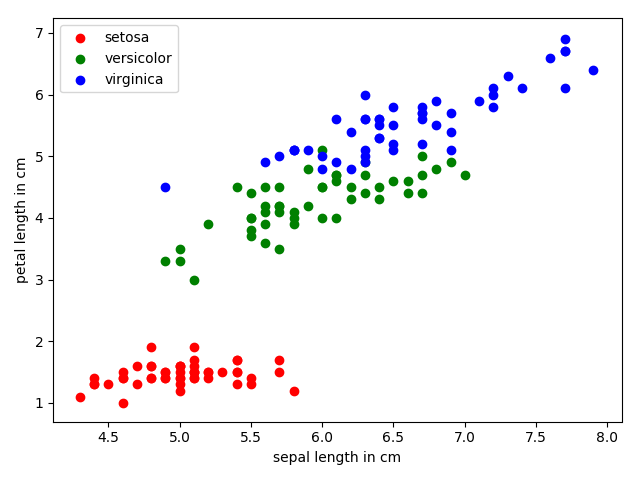
利用“6.1 扩展:Scikit-learn 经典机器学习经典入门小项目开发”中介绍的鸢尾花 iris数据集中的某两个特征(例如萼片长度和花瓣长度)绘制散点图。

实现:

1
2
3
4
5
6
7
8
9
10
11
12
13
14
15
16
17
18
# -*- coding: utf-8 -*-
# author:zhengk
from sklearn import datasets
import matplotlib.pyplot as plt

iris = datasets.load_iris()
x = [item[0] for item in iris.data]
y = [item[2] for item in iris.data]
# sample of setosa
plt.scatter(x[:50], y[:50], color='red', marker='o', label='setosa')
# sample of versicolor
plt.scatter(x[50:100], y[50:100], color='green', marker='o', label='versicolor')
# sample of virginica
plt.scatter(x[100:150], y[100:150], color='blue', marker='o', label='virginica')
plt.legend(loc='best')
plt.xlabel('sepal length in cm')
plt.ylabel('petal length in cm')
plt.show()

结果:

6_3_2

6.4 Pandas作图

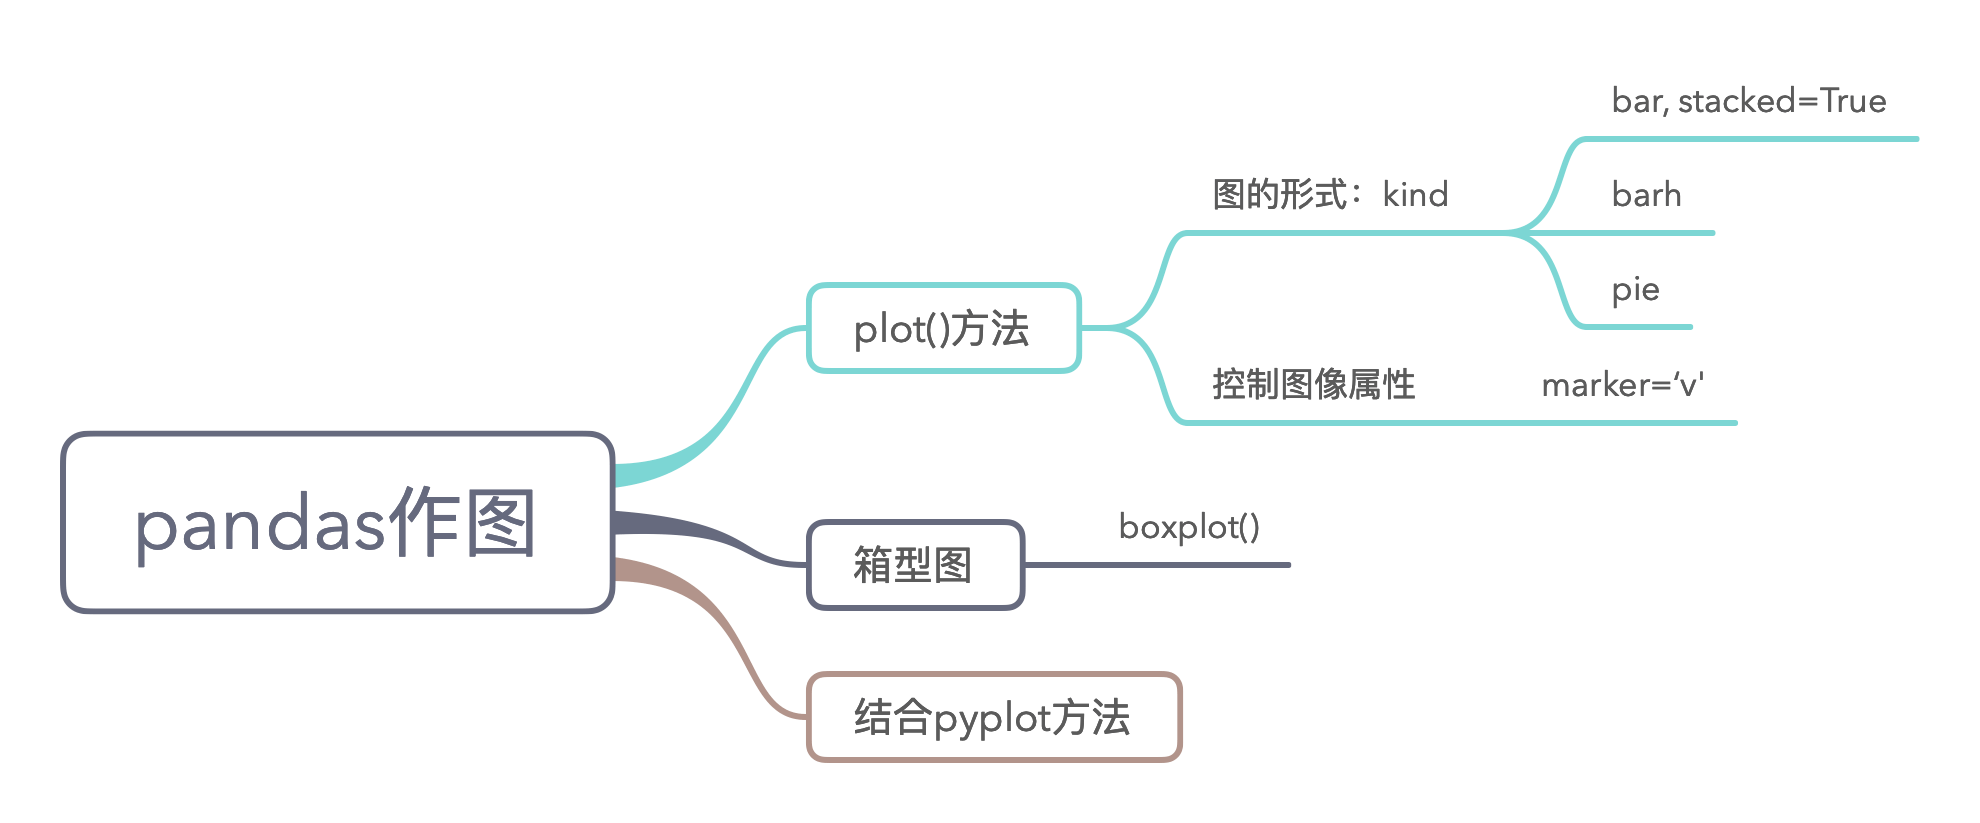
pandas作图